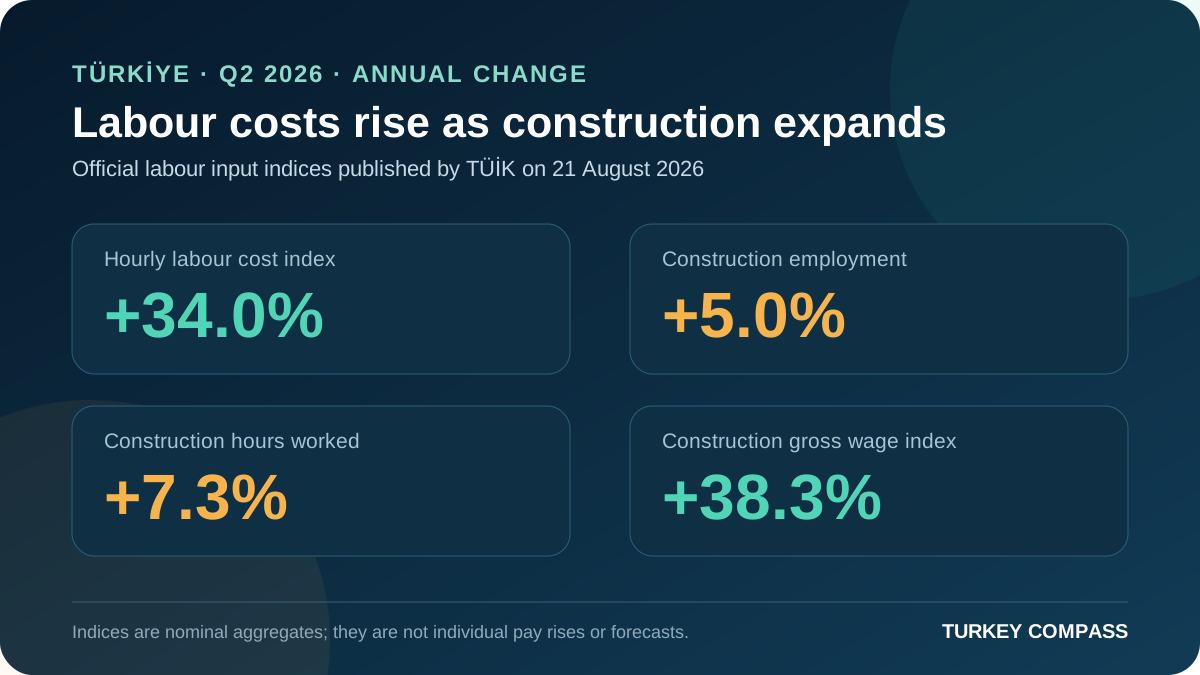
Türkiye's hourly labour cost index increased 34.0% year on year in the second quarter of 2026, according to TÜİK. The broader employment index rose 1.7%, but the national total concealed a split: industrial employment fell 2.2%, construction rose 5.0%, and trade and services rose 3.1%. Construction hours worked increased 7.3% from a year earlier. For employers and investors, the release is a cost and activity signal rather than a direct measure of household income or a forecast of future inflation.
The headline is an employer-cost index, not a salary promise
The hourly labour cost index covers earnings and non-wage labour costs borne by employers. TÜİK reported a 34.0% annual increase across industry, construction, trade and services. Its hourly earnings component rose 32.3%, while hourly non-wage labour costs increased 42.9%. These are nominal index changes across covered workplaces. They do not mean that every worker received the same percentage raise, and they do not describe take-home pay after tax and social-security deductions. A real-wage conclusion would also require a like-for-like comparison with consumer prices over the same period.
Construction was the clearest expansion pocket
Construction stood out on both labour volume and compensation measures. Employment in the sector rose 5.0% year on year and 2.1% from the previous quarter after adjustment. Hours worked climbed 7.3% annually and 7.1% quarter on quarter. The construction gross wage and salary index was 38.3% higher than a year earlier and 13.4% higher than in the first quarter. That combination is consistent with more labour being used and a rising nominal payroll bill. It is relevant to project budgeting, but it does not show which cities or building types generated the activity.
Industry and services moved in different directions
Industrial employment decreased 2.2% from a year earlier, even as the overall employment index grew. Trade and services added 3.1%, providing much of the support outside construction. The split matters for international companies considering a Turkish operation: a national labour figure can hide very different hiring conditions by sector. An exporter, a hotel operator, a software company and a residential developer should not use the same wage or recruitment assumption. Local labour availability, required skills, shifts, benefits and staff turnover need to be priced separately.
Quarterly data show momentum, with an important caveat
Compared with the first quarter, the seasonally and calendar-adjusted total employment index rose 0.8%, hours worked increased 1.2%, and the gross wage and salary index advanced 8.0%. The hourly labour cost index rose 7.0% quarter on quarter. Construction again recorded the largest rise in hours, at 7.1%, while its gross wage index increased 13.4%. Quarterly movements can be affected by timing, bonuses, holidays and changing sector composition. They are useful for detecting momentum but should not be annualised mechanically into a full-year forecast.
What this may mean for property and infrastructure projects
Labour is only one part of development cost, alongside land, materials, finance, permits, design, tax and sales expenses. A faster construction-hours index suggests active work, while a rising wage bill can tighten project budgets. Developers should update cash-flow models with actual subcontractor quotations rather than applying the 34.0% national index directly to every cost line. Buyers of off-plan property should also avoid treating stronger construction activity as proof that a particular project is on schedule. Progress, permits, title status and contractual delivery obligations must still be checked project by project.
A practical checklist for employers and investors
Before committing capital, request current gross-to-net payroll calculations, employer social-security costs, expected bonuses, meal and transport benefits, overtime assumptions, severance exposure and the cost of work-permit compliance for foreign staff. Compare at least two locations because salaries and recruitment difficulty can differ between Istanbul, Ankara, Izmir, Antalya and industrial centres. Model an adverse case in which labour costs and financing costs rise together. For construction, separate direct labour, subcontracted work and imported material exposure so that one national index is not allowed to distort the entire feasibility study.
How residents should read the wage number
A 35.8% annual increase in the gross wage and salary index does not establish that an individual's disposable income improved. The index aggregates payments across covered employees and can also change when employment composition, overtime or bonuses change. Residents comparing job offers should look at the monthly net amount, payment currency, review date, benefits, probation, working hours and the legal status of the contract. Housing, transport, school and health costs should be placed beside net income. The release is useful context for negotiations, not a substitute for a personal budget.
Turkey Compass assessment
The verified story is a sectoral divergence inside a rising cost environment: construction used more labour and more hours, trade and services expanded employment, and industry employed fewer workers than a year earlier. Employers' hourly labour costs rose by roughly one third in nominal index terms. That mix matters for business plans and construction budgets, but it is not evidence that every employee's real purchasing power rose or that all projects became equally expensive. The next decision should be based on sector, city, occupation and contract-level data rather than the national headline alone.