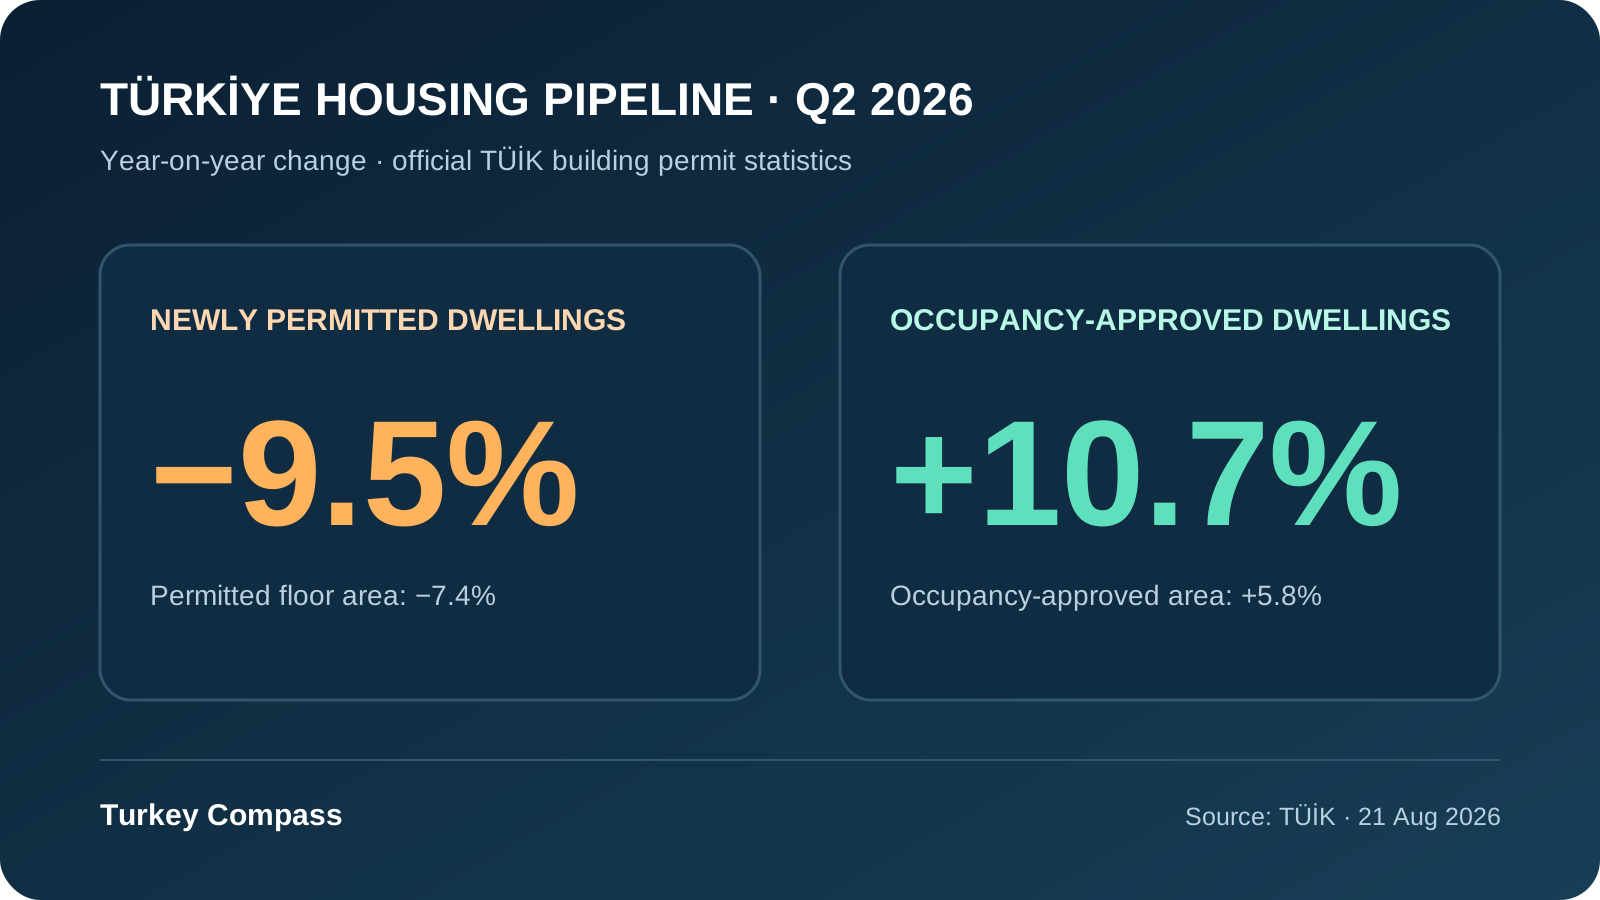
Türkiye's near-term housing pipeline sent two different signals in the second quarter of 2026. The number of dwellings covered by new building permits fell 9.5% from a year earlier, while the number receiving occupancy approval increased 10.7%. TÜİK also reported a 7.4% annual decline in permitted floor area and a 5.8% increase in occupancy-approved floor area. The figures suggest weaker entry into the construction pipeline alongside a larger flow of projects reaching the completion stage; they do not prove that national home prices must rise or fall next.
Permits and occupancy approvals answer different questions
A building permit authorises a planned project and is therefore an early indicator of potential future supply. An occupancy approval records a building that has reached the point at which its authorised use can be documented. In the second quarter, permitted building count fell 2.0%, permitted dwelling count fell 9.5% and permitted floor area fell 7.4% year on year. In contrast, occupancy-approved building count rose 13.7%, dwelling count rose 10.7% and floor area rose 5.8%. Reading only one side would hide the transition now occurring between new starts and completions.
The adjusted series confirms a softer pipeline
TÜİK's calendar-adjusted data show an even larger annual fall: permitted buildings declined 5.1%, permitted dwellings 11.4% and permitted floor area 9.4%. Compared with the previous quarter after seasonal and calendar adjustment, the number of permitted buildings edged up 0.3%, but permitted dwellings fell 4.9% and floor area fell 2.1%. The quarterly movement matters because it shows that the annual comparison is not only an artefact of last year's base. Even so, one quarter is not enough to establish a lasting shortage.
Apartments still dominate the development mix
Buildings with two or more dwellings accounted for the largest share of permitted floor area: 37.6 million square metres, or 71.1% of the total by intended use. Industrial buildings and warehouses followed with 4.5 million square metres. On the completion side, multi-dwelling residential buildings represented 19.4 million square metres and 67.9% of occupancy-approved area. The national mix therefore remains strongly residential, but the bulletin does not break the headline into the neighbourhood-level locations that determine actual demand and saleability.
Why this is not automatically a price forecast
A decline in permits can limit future supply if it persists, yet prices are also shaped by mortgage rates, household income, construction costs, land availability, unsold inventory, migration and local demand. Rising completions can temporarily expand the stock offered to buyers even while the next pipeline becomes thinner. The correct conclusion is that the flow of authorised new dwellings weakened in Q2 while more earlier projects reached completion. Turning that into a certain nationwide price increase would go beyond the evidence.
What foreign buyers should check
A national permit statistic does not verify an individual apartment. Buyers should request the title deed, zoning position, building permit, approved architectural project, construction servitude or condominium status, and occupancy permit where applicable. The name and date on each document must match the actual block and independent unit. For an unfinished project, the contract should define completion, specifications, delay remedies and refund conditions. For a completed unit, physically inspect the property and compare its legal plan with what is being sold.
Implications for developers and investors
Developers face a market in which fewer authorised dwellings may reduce future competition, but that does not make every new project viable. Land cost, financing, labour, materials, sales pace and the purchasing power of the target audience still determine feasibility. Investors should compare local listings with completed transactions and rental demand rather than treating a national percentage as a city forecast. Istanbul, Antalya, Ankara, Izmir and smaller coastal markets can move very differently because their inventories and buyer profiles are not the same.
Turkey Compass assessment
The strongest verified message is the divergence: new permitted dwelling numbers declined while completions increased. That is meaningful for anyone tracking the housing pipeline, but it is neither proof of an immediate shortage nor a guarantee of investment returns. The next release, scheduled for 24 November 2026, will show whether the reduction in permits continues. Until then, use the national series as context and base a purchase on parcel-, project- and district-level documents, supply and demand.