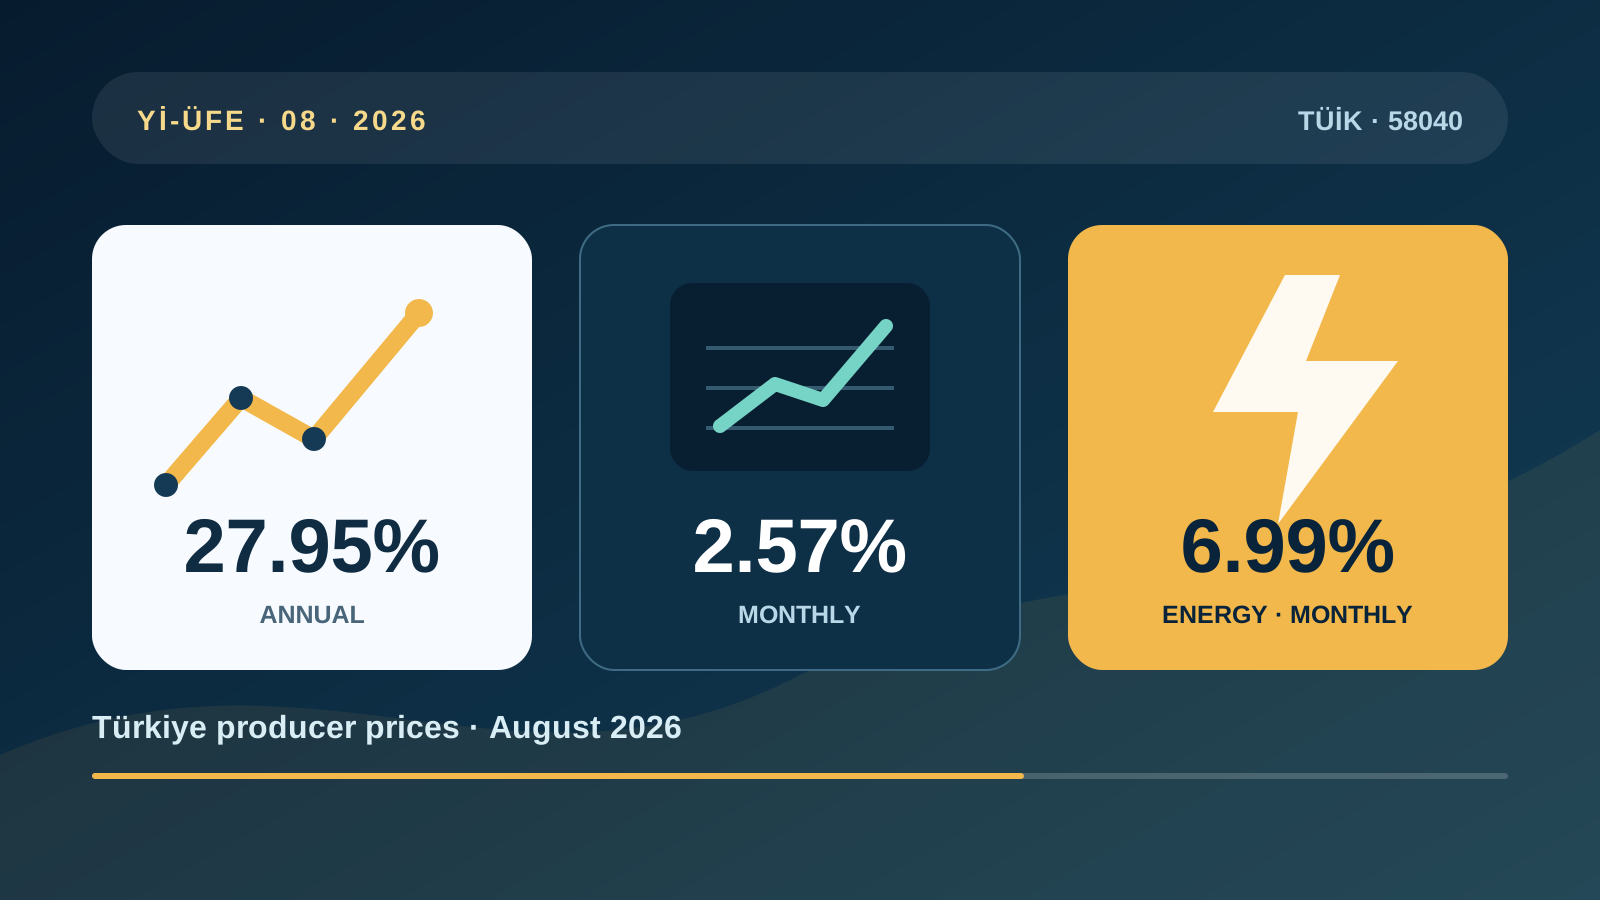
Türkiye's Domestic Producer Price Index rose 2.57% in August 2026 and was 27.95% above a year earlier, TÜİK reported on 3 September. The monthly increase accelerated from July's 1.52%, while the annual rate edged up from 27.83%. For international companies, importers and investors, the most useful signal is not simply that producer inflation remained below consumer inflation. Energy costs strengthened sharply during the month and manufacturing prices continued to rise, pointing to cost pressure that may affect margins, contracts and capital budgets unevenly across sectors.
The monthly pace strengthened more clearly than the annual rate
Producer prices increased 2.57% from July, 20.88% from December 2025, 27.95% from August 2025 and 27.76% on a 12-month-average basis. July's comparable monthly and annual readings were 1.52% and 27.83%. The annual move was therefore small, but the latest monthly step was materially faster. A single month does not establish a trend, yet businesses setting prices or renegotiating supply terms should not read the nearly stable annual rate as proof that cost momentum has disappeared.
Energy was the strongest main industry group in August
Among the five main industry groups, energy prices rose 6.99% in one month. Durable consumer goods followed at 2.84%, intermediate goods at 1.84%, capital goods at 1.76% and non-durable consumer goods at 1.51%. These are broad output groupings rather than company-specific bills. The energy result can still matter widely because power and fuel enter transport, production and storage costs, but the pass-through depends on hedging, regulated tariffs, inventory, exchange rates and each firm's ability to absorb or transfer expenses.
Manufacturing prices rose 2.35% during the month
Manufacturing, the largest of the four headline sectors, recorded a 2.35% monthly rise and a 29.68% annual increase. Electricity and gas production and distribution increased 6.03% in August, water supply rose 1.40%, while mining and quarrying declined 0.14%. The monthly fall in mining does not mean raw-material costs broadly fell, and the electricity figure does not describe every business tariff. The index combines many products and producers, so procurement teams should compare the national signal with their own invoices and supplier mix.
Annual sector readings tell a different story from the latest month
Mining and quarrying had the fastest annual increase at 38.88%, followed by manufacturing at 29.68% and water supply at 29.59%. Electricity and gas production and distribution was only 7.57% higher than a year earlier despite its strong August rise. That contrast illustrates a base effect: a modest annual figure can coexist with a sharp latest-month movement. Investors assessing utilities or energy-intensive manufacturing should separate the change over twelve months from the fresh cost impulse rather than collapsing both into one inflation label.
Non-durable consumer goods still had the highest annual group rate
By main industry group, non-durable consumer goods rose 30.28% over the year. Durable consumer goods increased 28.54%, intermediate goods 27.41%, energy 27.33% and capital goods 22.06%. The lower capital-goods rate is not a forecast that machinery or construction equipment will become cheaper; it means the measured basket rose more slowly than the other groups over this comparison period. Foreign businesses should also remember that imported inputs may respond more directly to currency movements than this domestic-output index suggests.
Producer inflation is not a timetable for shop prices
Yİ-ÜFE measures prices that domestic producers receive for industrial output, while TÜFE measures the consumer basket. Their coverage, weights and price-collection points differ. August consumer inflation was 1.84% monthly and 31.51% annually, so the two indices moved at different speeds. Producer costs can eventually influence retail prices, but taxes, wages, distribution, demand, inventories and margins affect both timing and scale. It would therefore be inaccurate to claim that a 2.57% producer increase guarantees the same rise for consumers next month.
How investors and operators can use the release
The bulletin is best treated as a national cost benchmark. Importers can compare it with exchange-rate and freight movements; manufacturers can test whether their own energy and intermediate-input costs are moving faster; property and hospitality operators can use it as context for maintenance and procurement budgets. It does not replace audited company accounts, a supplier quotation or sector-specific indices. The cautious August conclusion is that domestic industrial cost pressure accelerated month to month, with energy prominent, while the year-on-year producer rate remained below headline consumer inflation.