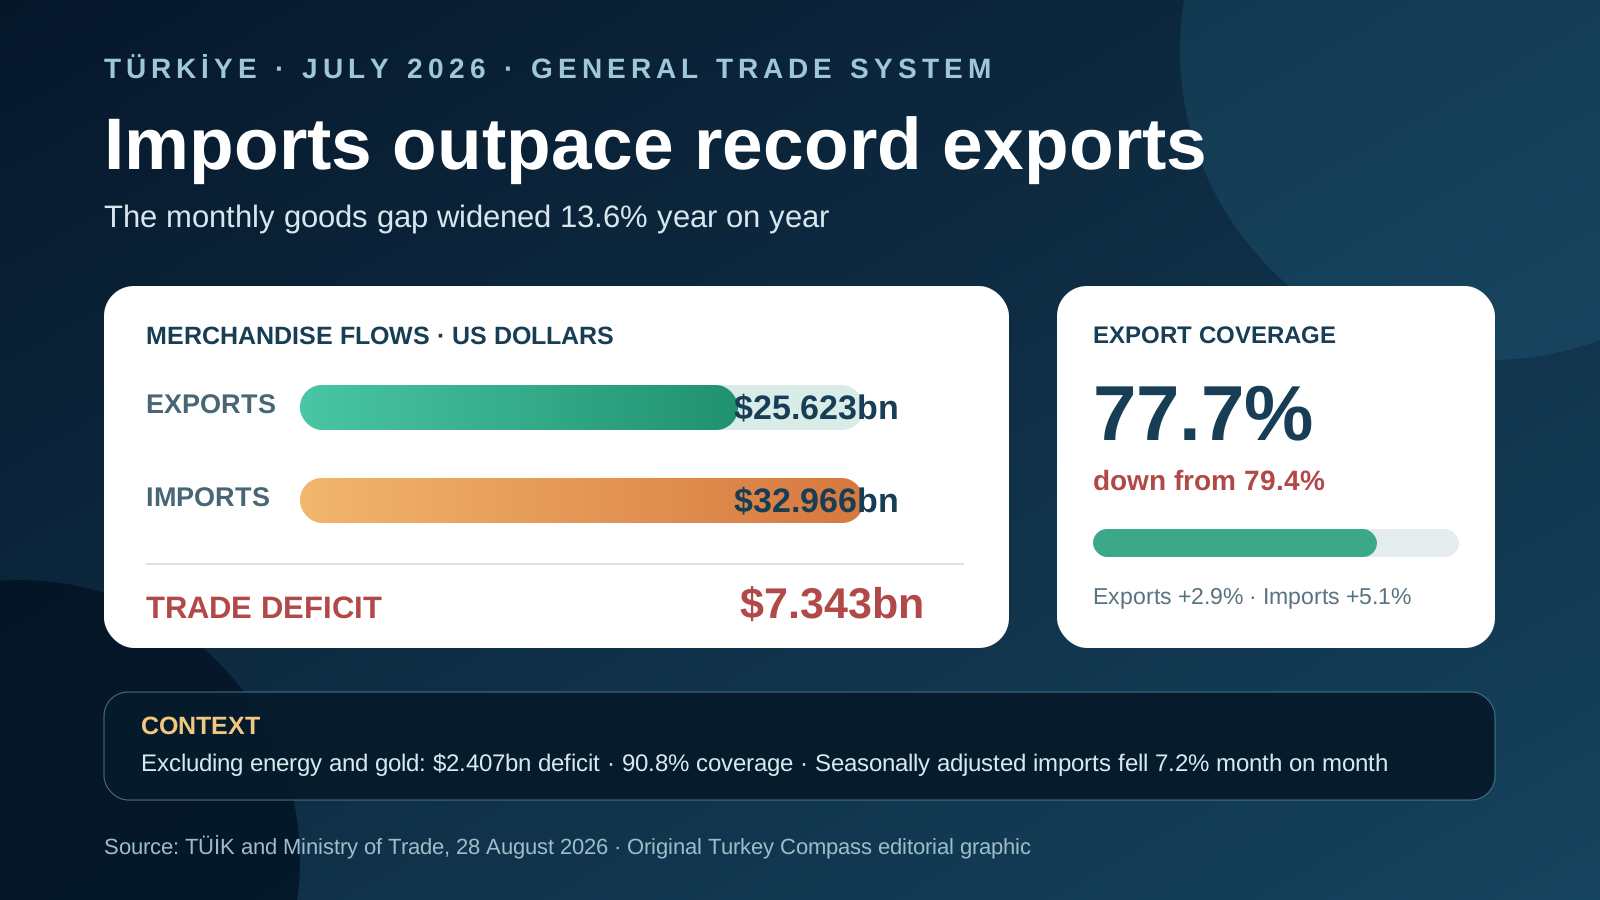
Türkiye's merchandise exports rose 2.9% year on year to $25.623 billion in July 2026, setting a July record, yet imports increased faster at 5.1% to $32.966 billion. The result was a $7.343 billion monthly trade deficit, 13.6% larger than a year earlier. For international readers, the important development is therefore not the export record alone but the widening gap between outbound and inbound goods. The release is provisional and measured in current US-dollar values under the general trade system. It is useful for reading demand, manufacturing and external financing pressures, but it is not a direct forecast for the lira, inflation or corporate earnings.
The headline balance weakened despite higher exports
The July deficit increased from $6.463 billion in 2025 to $7.343 billion in 2026 because the import bill grew more rapidly than export receipts. The export-to-import coverage ratio consequently slipped from 79.4% to 77.7%. In plain terms, every $100 of imported goods was matched by about $77.70 of exported goods during the month. This ratio is a gross merchandise indicator rather than a complete external-accounts measure: tourism income, services, investment flows and financing do not appear in the goods table. A record export total can therefore coexist with a weaker monthly goods balance.
The seven-month trend points in the same direction
From January through July, exports reached $161.539 billion, up 3.4% from the same period of 2025. Imports totalled $222.085 billion, an increase of 4.7%. The cumulative deficit widened 8.3% to $60.545 billion, while the coverage ratio eased from 73.6% to 72.7%. This longer window is less sensitive to a single large shipment than the July comparison, but it still reflects nominal dollar values and a changing product mix. Investors should compare it with energy prices, gold flows, industrial production and the current account before drawing a macroeconomic conclusion.
Excluding energy and gold narrows, but does not erase, the gap
TÜİK also publishes a measure excluding energy products and non-monetary gold, two categories that can create large swings. On that basis, July exports were $23.788 billion and imports $26.194 billion. The adjusted goods deficit was $2.407 billion and the coverage ratio was a much stronger 90.8%. Exports in this measure rose 3.1% year on year and imports 3.6%. The comparison shows that energy and gold explain a substantial part of the headline shortfall, but not all of it. Excluding them is an analytical lens, not a substitute for the official total that must still be financed.
Month-on-month data offer a necessary counterpoint
Seasonally and calendar-adjusted figures moved differently from the annual headline. Compared with June, exports rose 2.6% while imports fell 7.2% in July. This does not contradict the 13.6% annual widening of the deficit: the two comparisons use different baselines and the adjusted series removes recurring calendar and seasonal effects. A company planning inventory or cash flow should therefore avoid mixing the measures. The annual comparison describes where July stands against July 2025; the adjusted monthly series is more useful for identifying very recent momentum. Several months are needed before calling either movement a lasting trend.
Germany led exports; China and Russia led imports
Germany was Türkiye's largest July export market at $2.042 billion, followed by the United States at $1.683 billion, the United Kingdom at $1.349 billion, Iraq at $1.113 billion and Italy at $1.110 billion. On the import side, China ranked first at $5.040 billion and Russia second at $3.232 billion, ahead of Germany at $2.521 billion, the United States at $1.889 billion and Italy at $1.553 billion. The five leading import sources accounted for 43.2% of the total. These gross flows do not by themselves reveal value added, payment currency, sanctions exposure or profitability; contract-level checks remain essential.
The product structure matters for industrial investors
Manufactured goods represented 94.4% of exports in July. Intermediate goods accounted for 69.4% of imports, with capital goods at 14.5% and consumer goods at 16.0%. A large intermediate-goods share means part of the import bill feeds production and later exports rather than final consumption. Technology intensity also remains asymmetric: high-technology products were 4.4% of manufactured exports but 12.7% of manufactured imports. This gap is relevant to investors considering local supply chains, component production or technology partnerships, yet it cannot be converted mechanically into a measure of competitiveness because prices, processing stages and re-exports differ.
How to use the release without overreading it
International businesses should separate three questions. First, does their sector benefit from rising export demand in Germany, the United States or the United Kingdom? Second, how exposed are costs and delivery schedules to inputs from China, Russia or the European Union? Third, are contracts protected against currency, freight and commodity-price changes? The July bulletin can identify where to investigate, but it does not forecast exchange rates or guarantee stronger sales. Turkey Compass's reading is balanced: export capacity remained resilient and the latest adjusted monthly movement improved, while the annual and seven-month goods deficits widened. Both sides belong in an investment decision.