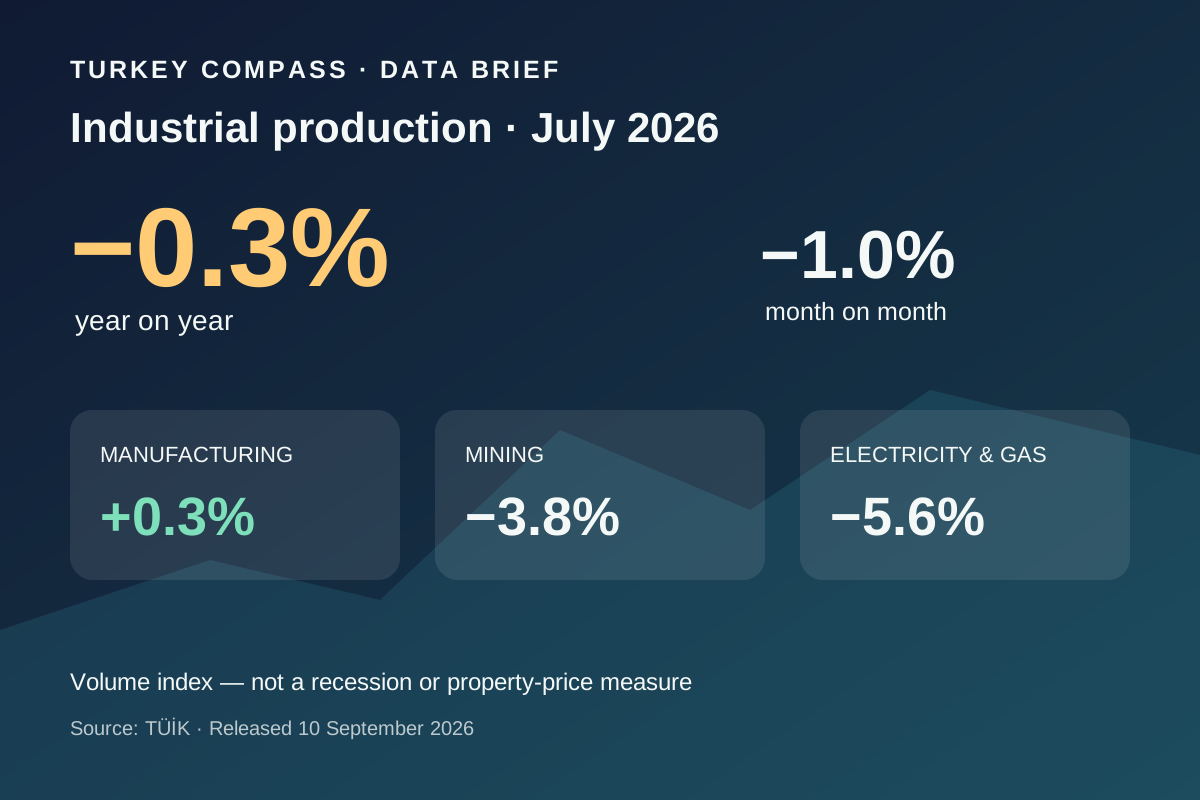
Türkiye's industrial production decreased by 1.0% month on month and 0.3% year on year in July 2026, according to the official TÜİK release published on 10 September. The headline is a modest contraction, but the sector split is more informative: manufacturing remained 0.3% above July 2025 while mining and utilities declined. International investors should treat the release as an early signal for demand, capacity and supplier conditions—not as proof of a recession or a direct forecast for exchange rates, company earnings or property prices.
Manufacturing held up better than mining and utilities
On a calendar-adjusted annual basis, manufacturing output increased by 0.3%. Mining and quarrying fell by 3.8%, while electricity, gas, steam and air-conditioning production and distribution declined by 5.6%. Those components pulled the total industrial index 0.3% below its July 2025 level. A business exposed to machinery, textiles, food or vehicles therefore needs its own industry data; the national total cannot show whether a particular order book expanded or contracted.
The monthly reading was weaker across all three groups
Compared with June, the seasonally and calendar-adjusted total fell by 1.0%. Mining decreased by 2.2%, manufacturing by 0.8% and electricity and gas by 2.2%. The annual and monthly figures answer different questions and use different adjustments. The annual change compares output with July 2025 after calendar effects; the monthly change measures momentum from June after seasonal and calendar effects. Mixing them can make a small change look much larger than it is.
How an international operator can use the signal
Importers, exporters and manufacturers can compare the release with their own orders, capacity use, delivery times and inventory. A supplier may face weaker domestic demand while benefiting from export contracts, or the reverse. Test revenue and working capital under at least two volume scenarios, then separate lira costs from euro or dollar income. The index does not identify profitable companies or sectors, and it should not replace audited accounts, customer concentration checks or contract-level currency analysis.
It is not a housing or construction price index
Industrial production measures the volume of industrial output. It does not measure home sales, construction input prices, rents or asset values. A factory slowdown can eventually affect employment, logistics or commercial space in some regions, but that connection must be demonstrated with local evidence. Property investors should combine the release with building permits, construction costs, completed transactions, vacancy and verified rent rather than using the national industrial percentage as a valuation shortcut.
What to monitor before the next release
TÜİK's calendar sets the August industrial production bulletin for 9 October 2026. Before then, investors can watch export orders, capacity utilisation, producer prices, employment and company guidance. One month of data can be revised and does not establish a durable trend. Turkey Compass's fact-check conclusion is therefore limited: output softened in July, the latest monthly move was negative across the main groups, but manufacturing was still marginally higher than a year earlier.