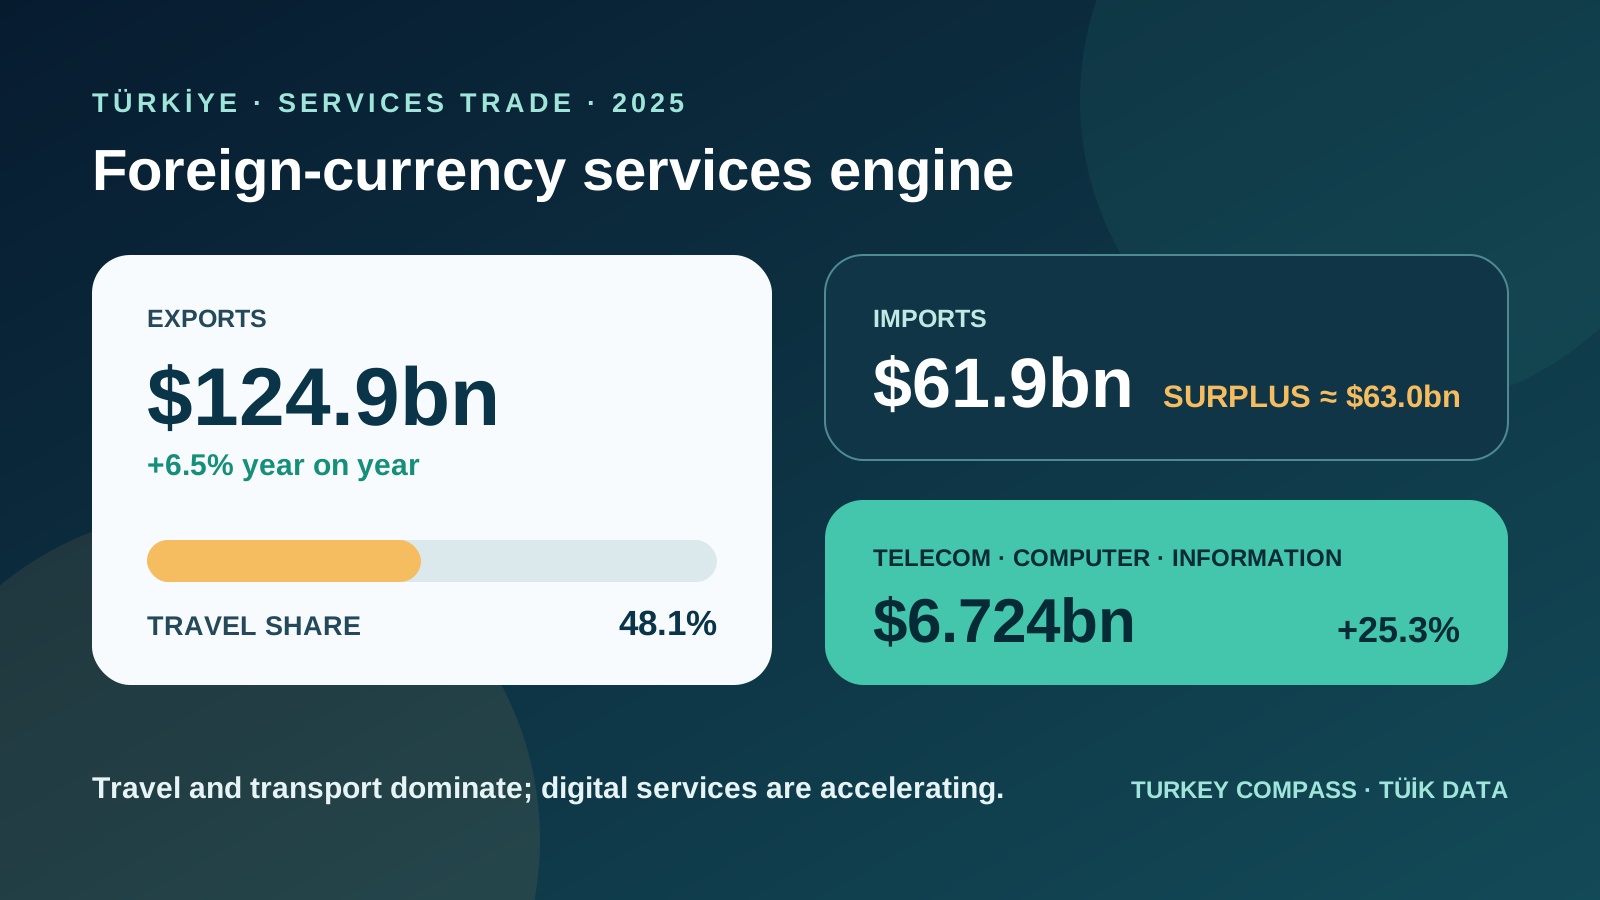
Türkiye exported $124.9 billion of services in 2025, 6.5% more than in 2024, while imports rose 9.6% to $61.9 billion, TÜİK reported on 4 September 2026. The difference is a services surplus of about $63.0 billion. Travel remained the largest export component, but the fastest prominent growth signal came from telecommunications, computer and information services, whose exports increased 25.3% to $6.724 billion. For international investors, the release shows an economy earning foreign currency through tourism, transport and a growing digital-services segment. It does not show the profitability of an individual company or guarantee that every service industry expanded.
Exports grew, but imports grew faster
Services exports increased from $117.3 billion in 2024 to $124.9 billion in 2025. Imports moved from $56.4 billion to $61.9 billion. That means export growth of 6.5% and import growth of 9.6%, according to TÜİK. Subtracting the two rounded totals gives a surplus of roughly $63.0 billion, slightly above the previous year's approximate $60.9 billion. The balance therefore remained strongly positive even though imports expanded faster. These are annual nominal dollar values; they do not isolate price changes, exchange-rate effects or the volume of work delivered.
Travel generated almost half of services exports
Travel services accounted for 48.1% of total services exports in 2025, compared with 48.0% in 2024. Applied to the published total, that share corresponds to roughly $60.1 billion, although the release presents the share rather than this derived amount in the headline text. The category includes spending associated with international travel and has been aligned with the balance-of-payments dataset. Tourism remains a major foreign-currency engine, but the figure is national: it cannot establish hotel occupancy, rental demand or visitor spending in a particular province.
Transport remained the second pillar
Transport services exports reached $42.571 billion, up 3.5% from $41.125 billion in 2024, and represented 34.1% of services exports. Together, travel and transport made up more than four-fifths of the export total. This concentration matters for airlines, airports, ports, logistics companies and destinations, but it also leaves the balance sensitive to global travel demand, freight conditions and geopolitical disruption. A higher national transport value does not automatically mean that every route, carrier or logistics operator gained traffic or margin.
Digital services supplied the strongest growth clue
Exports of telecommunications, computer and information services increased 25.3% to $6.724 billion. The category is still much smaller than travel or transport, yet its growth rate is strategically important because software, data, IT and communications can be sold across borders without the same physical capacity constraints as hotels or freight fleets. Investors should treat the figure as a market signal, not a valuation shortcut. The release does not disclose company concentration, wages, recurring revenue, customer retention or how much activity came from foreign-owned businesses operating in Türkiye.
The EU led non-travel services trade
TÜİK's geographical tables exclude travel services. Within that narrower scope, Türkiye exported $25.330 billion of services to European Union countries and imported $24.733 billion from them in 2025. The EU represented 37.9% of non-travel services exports and 45.3% of imports. This underlines the importance of European business links in consulting, technology, transport and other cross-border services. It must not be read as the EU's share of all services trade, because tourists' spending is deliberately absent from the country and region breakdowns.
The United States led exports; Ireland led imports
Excluding travel, the United States was Türkiye's largest individual services-export market, receiving $8.338 billion, or 12.9% of the relevant total. Germany ranked second with an 11.5% share and the United Kingdom third with 6.6%. On the import side, Ireland led with $6.667 billion and a 12.6% share, followed by the United Kingdom at $4.797 billion and the United States at $4.378 billion. Large technology, licensing and professional-service flows can influence these rankings, so the table should not be interpreted as a tourism league.
What the methodology change means
TÜİK says travel services are now included in the bulletin and service-type tables to harmonise the series with balance-of-payments statistics. Country and region tables remain travel-excluded. Readers should therefore compare like with like: the $124.9 billion headline total includes travel, while statements about the United States, Germany, the United Kingdom or the EU do not. Apparent differences between official publications may reflect scope, revision timing or classification rather than an error. The source, period and definition should be checked before combining figures.
A practical investor reading
Tourism and logistics businesses can use the data to test whether their own bookings, capacity and prices followed the national direction. Technology firms should examine the 25.3% export expansion alongside customer geography, skilled-labour costs, tax treatment and payment collection. Foreign investors should compare service demand with company accounts, permits, contracts and currency exposure. The defensible conclusion is that Türkiye kept a large services surplus in 2025, travel and transport still dominated, and digital-service exports grew rapidly; the bulletin alone does not promise returns or replace due diligence.